Here’s How Home Prices Have Changed in Houston

Why you can trust Move.org
movers helped every month
20k
moving grants awarded
24
moving companies evaluated
156
years of expert experience
80+

For over 8 years Move.org experts have examined pricing, credentials, and real customer reviews to give you (human) recommendations you can trust. See how we review.

Joe Roberts
Feb 28, 2022
Icon Time To Read2 min read

Home prices are going up across the country, and Houston, Texas, is no exception. Home values in Houston have more than doubled in the last 20 years, and there’s no indication they’re coming back down anytime soon.

Not every Houston neighborhood has seen the same rate of increase, though. Some neighborhoods—like the Clinton Park Tri-Community neighborhood—have seen much narrower increases to their home values compared to their prices in the year 2000.

That said, Houston’s home prices are still going up at an alarming rate, especially since we’ve found that the city’s median income isn’t increasing as quickly. This is a huge problem for first-time homebuyers who don’t yet have equity built up to put toward mortgages for new homes.

Whether you’re a prospective homeowner looking to put down roots in Houston, a general contractor surveying the city for future development, or a realtor researching Houston’s housing market, keep reading. We’ve broken the data down by neighborhood to help you find Houston’s most and least affordable areas.

Key findings

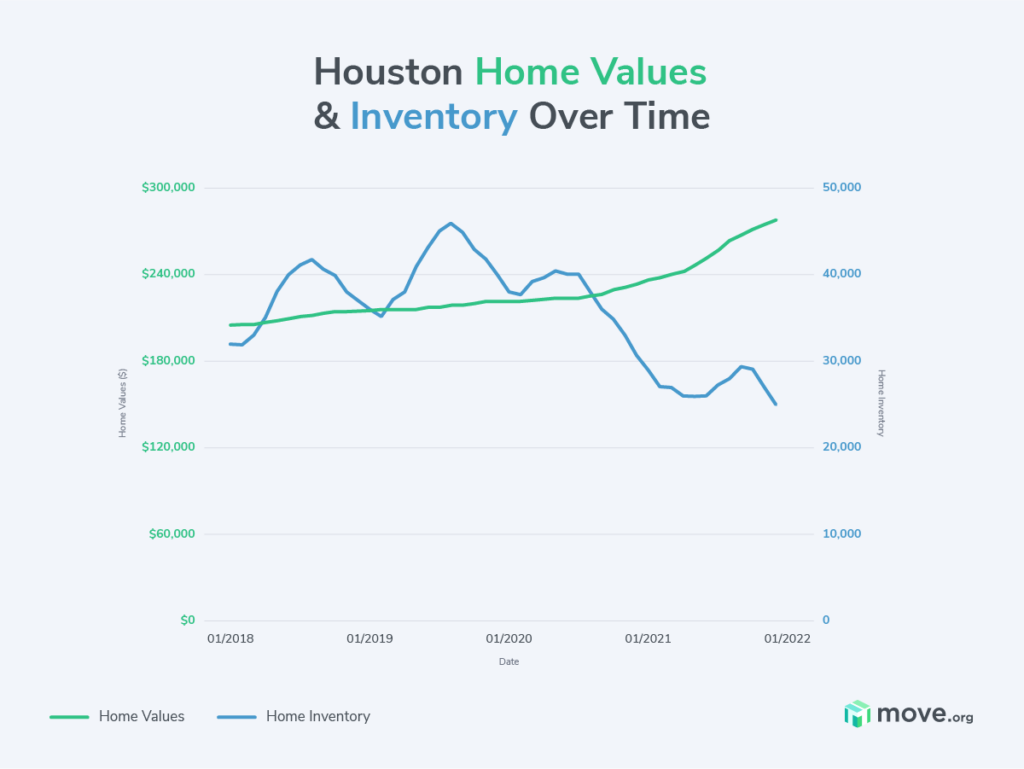
  • In January 2000, Houston’s average home value sat at $125,344. In December 2021, it was $278,685.
  • Between the years 2000 and 2019, Houston’s population went from 1,974,324 to 2,320,268, an increase of 345,944 people.
  • The median household income in Houston increased by only 56.2% between 2000 and 2019, and it actually decreased in several neighborhoods.
  • Out of the 88 Houston neighborhoods we looked into, only Westwood had home values below Houston’s overall average from 2000. Homes in Westwood are currently going for about $61,475.
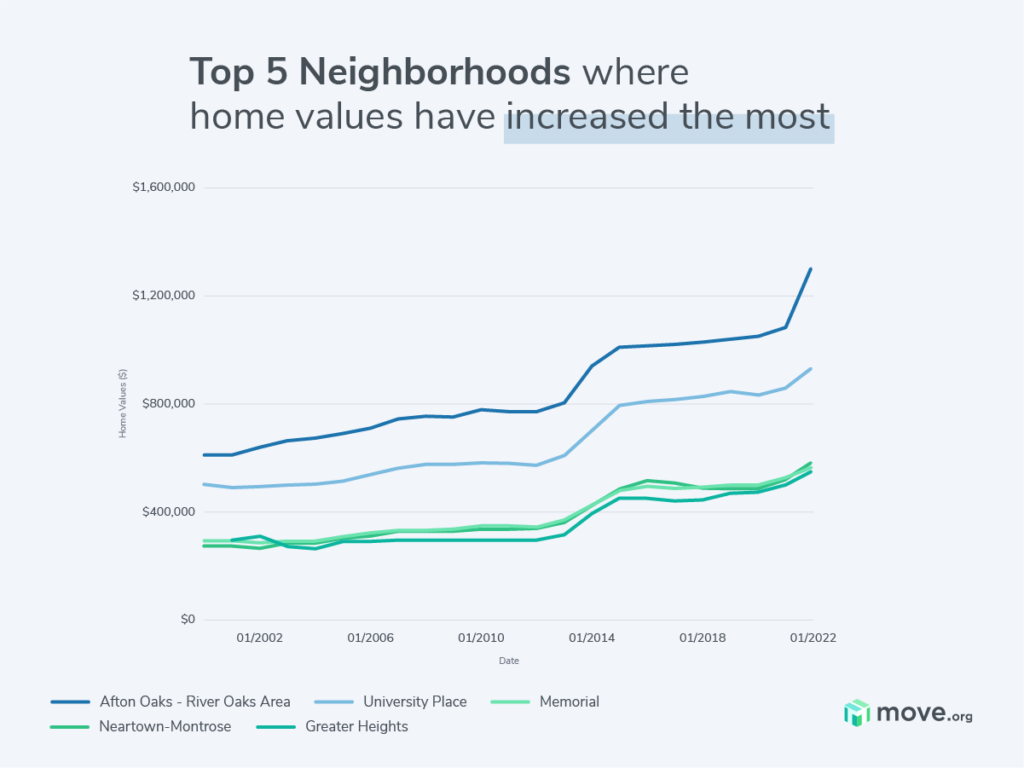
  • The average home price in the Afton Oaks‐River Oaks Area—Houston’s most expensive neighborhood—is $1,303,275.
  • Over the last three years, Houston’s available home inventory has fluctuated a lot. The city’s December 2021 inventory of 25,486 available homes is the lowest it’s been since January 2018.
Megaphone
Looking for movers in Houston?

If you’re moving locally in or around Houston and you want to hire trustworthy movers, check out our list of Houston’s best local moving companies. Alternatively, if you’re moving to Houston from another state or you’re moving out of Texas, one of our favorite long-distance movers will be what you’re looking for.

Company
Least expensive quote
Packing & loading services
Move.org rating
Discounts
Learn more
$9,000*
Icon Yes  LightYes
4.8 out of 5 stars
4.8
Icon Yes  LightMove.org discount, Military, Seniors
$6,214*
Icon Yes  LightYes
4.5 out of 5 stars
4.5
Icon No  LightNone
$4,500*
Icon Yes  LightYes
4.8 out of 5 stars
4.8
Icon Yes  LightSeniors
$848
Icon No  LightNo
4.6 out of 5 stars
4.6
Icon Yes  LightMove.org discount, Military
$1,170
Icon No  LightNo
4.5 out of 5 stars
4.5
Icon Yes  LightMove.org discount, Military

Data as of post date. Offers and availability may vary by location and are subject to change. Pricing data collected by requesting estimates from top moving container companies for four home sizes across six distances.

*Based on a 3-bedroom across-country move.


Methodology

We ranked Houston’s neighborhoods based on their 2021 home values. While we looked at historical data as well, we didn’t factor past home values or value increases over time into our rankings. We used Zillow’s Home Value Index to gather our data about Houston’s current and historical home prices and Houston’s housing inventory.[1]

For additional context, we also researched Houston’s population, demographic data, and median household income over the last 21 years. For population data, we used the United States Census Bureau’s estimates.[2],[3]

We gathered demographic data and median household income data from the City of Houston’s website and the United States Bureau of Labor Statistics.[4],[5],[6]


Home values in Houston’s 10 most expensive neighborhoods

Rank
Neighborhood
Average home value in 2000
Average home value in 2010
Average home value in 2021
1Afton Oaks-River Oaks Area$629,533$775,488$1,303,275
2University Place$506,091$579,568$930,024
3Memorial$272,964$326,614$585,724
4Neartown-Montrose$296,936$332,543$562,575
5Greater HeightsN/A$291,552$551,935
6Braeswood PlaceN/A$363,159$531,214
7Lazy Brook-TimbergroveN/A$299,349$510,198
8Binz$293,593$329,218$466,661
9Medical Center AreaN/A$297,174$463,554
10Greenway-Upper Kirby Area$252,900$284,334$458,692

Home values in Houston’s 10 least expensive neighborhoods

Rank
Neighborhood
Average home value in 2000
Average home value in 2010
Average home value in 2021
1WestwoodN/AN/A$61,475
2Harrisburg-Manchester$63,825$65,489$143,244
3Clinton Park Tri-Community$124,343$78,955$146,195
4Trinity-Houston Gardens$69,275$75,253$151,321
5Kashmere Gardens$81,641$80,865$151,823
6Astrodome Area$86,406$101,033$152,874
7Settegast$98,696$81,935$153,965
8Sunnyside$86,950$99,688$156,796
9South Park$69,243$92,075$158,204
10Denver Harbor-Port Houston$91,740$71,591$158,519

Sources

  1. Zillow, “Housing Data.” Accessed February 1, 2022.
  2. United States Census Bureau, “City and Town Intercensal Datasets: 20002010.” Accessed February 1, 2022.
  3. United States Census Bureau, “City and Town Intercensal Datasets: 20102019.” Accessed February 1, 2022.
  4. City of Houston, “20112015 Demographic Information.” Accessed February 1, 2022.
  5. City of Houston, “2019 Demographic Information.” Accessed February 1, 2022.
  6. United States Bureau of Labor Statistics, “Houston.” Accessed February 1, 2022.

Home values in Houston’s neighborhoods

Rank
Neighborhood
Average home value (January 2000)
Average home value (December 2021)
1Afton Oaks - River Oaks Area$629,533$1,303,275
2University Place$506,091$930,024
3Memorial$272,964$585,724
4Neartown - Montrose$296,936$562,575
5Greater HeightsN/A$551,935
6Braeswood PlaceN/A$531,214
7Lazy Brook - TimbergroveN/A$510,198
8Binz$293,593$466,661
9Medical Center AreaN/A$463,554
10Greenway - Upper Kirby Area$252,900$458,692
11Washington Avenue Coalition - Memorial Park$254,655$458,166
12Oak Forest - Garden OaksN/A$428,129
13Spring Branch East$206,152$426,177
14Meyerland Area$251,274$421,489
15Greater Uptown$244,232$400,413
16Macgregor$195,930$374,551
17Briarforest Area$182,952$369,693
18Spring Branch West$127,817$360,418
19Fourth Ward$192,724$354,978
20Spring Branch North$139,915$351,746
21Downtown$200,624$339,354
22Midtown$199,457$336,520
23Willow Meadows - Willowbend Area$206,838$336,176
24Spring Branch Central$153,163$334,778
25Lake Houston$163,035$330,474
26Greater EastwoodN/A$322,890
27Westbury$129,346$308,161
28Kingwood$153,965$306,665
29Eldridge - West Oaks$151,477$304,698
30Clear Lake$143,984$301,104
31Second Ward$177,704$289,116
32Northside Village$134,328$286,119
33Greater Third Ward$88,510$268,381
34Lawndale - Wayside$106,454$261,169
35Addicks Park Ten$113,456$256,033
36WillowbrookN/A$237,998
37Fairbanks - Northwest Crossing$98,252$236,462
38Woodlake - Briarmeadow$120,776$235,841
39Independence Heights$78,070$232,660
40Westbranch$91,446$232,481
41Minnetex$109,716$231,719
42South Belt - Ellington$92,758$227,820
43Langwood$89,181$218,355
44Greater Fondren Southwest$86,520$218,014
45Greater Hobby Area$88,197$217,466
46Braeburn$84,190$214,722
47Carverdale$83,731$213,150
48Sharpstown$75,574$208,022
49Greater Inwood$80,250$206,993
50Alief$64,950$204,355
51Hidden Valley$82,807$200,943
52Northside-Northline$76,324$199,053
53Fort Bend - Houston$82,517$198,518
54Edgebrook Area$83,034$197,153
55Hunterwood$68,597$196,326
56Golfcrest - Bellfort - Reveille$80,995$194,532
57Central Southwest$84,054$194,357
58South MainN/A$193,881
59Gulfton$95,173$193,860
60Gulfgate Riverview - Pine Valley$72,673$193,013
61Pecan Park$67,437$188,213
62Park Place$71,238$187,997
63Iah - Airport Area$70,682$187,117
64Meadowbrook - Allendale$78,349$184,245
65Magnolia Park$82,146$183,438
66Greater Greenspoint$62,351$179,678
67Acres Home$74,459$178,799
68Northshore$65,342$177,701
69Ost - South Union$86,326$177,409
70South Acres - Crestmont Park$78,160$172,852
71Greater Fifth Ward$113,138$171,479
72El Dorado - Oates Prairie$63,518$170,510
73East Little York - Homestead$67,884$170,271
74Eastex - Jensen Area$69,391$165,470
75East Houston$69,792$164,359
76Fondren Gardens$60,884$164,094
77Pleasantville Area$64,936$161,834
78Westchase$97,855$159,543
79Denver Harbor - Port Houston$91,740$158,519
80South Park$69,243$158,204
81Sunnyside$86,950$156,796
82Settegast$98,696$153,965
83Astrodome Area$86,406$152,874
84Kashmere Gardens$81,641$151,823
85Trinity - Houston Gardens$69,275$151,321
86Clinton Park Tri-Community$124,343$146,195
87Harrisburg - Manchester$63,825$143,244
88Westwood$61,475
Joe Roberts
Written by
Joe Roberts is a professional writer with a degree in writing studies and over four years of copywriting experience. He previously worked at Overstock.com, where he wrote about furniture, home decor, and moving. Joe has moved all over Utah, so he knows his way around a moving truck—and he spends his time (and money) expanding his personal library so it will be even heavier next time he moves.