Where Did Rental Prices Increase and Decrease the Most in 2021?

Why you can trust Move.org
movers helped every month
20k
moving grants awarded
24
moving companies evaluated
156
years of expert experience
80+

For over 8 years Move.org experts have examined pricing, credentials, and real customer reviews to give you (human) recommendations you can trust. See how we review.

Trevor Wheelwright
Dec 02, 2021
Icon Time To Read2 min read

For most folks, rent’s on the rise in the wake of the pandemic. In the 75 most populated cities in the US, the average price of rent increased by 5.54% from 2020 to 2021.1,2,3

By combining population and rental data, we found out which big cities faced the most significant increases and decreases for one-bedroom rent pricing from 2020 to 2021. (For more info, see our full methodology.)

The vast majority of the big cities in the US saw a rent growth in 2021 of at least 5%.

However, 16 big cities (including New York, New York, and San Francisco, California) saw decreases in rental prices. That means for a few folks, now, while the rental market is hot, might be the perfect time to move to the city of your dreams.
Rental Industry 2021_V3_Onsite Image copy 2

Where did rent increase the most in the US?

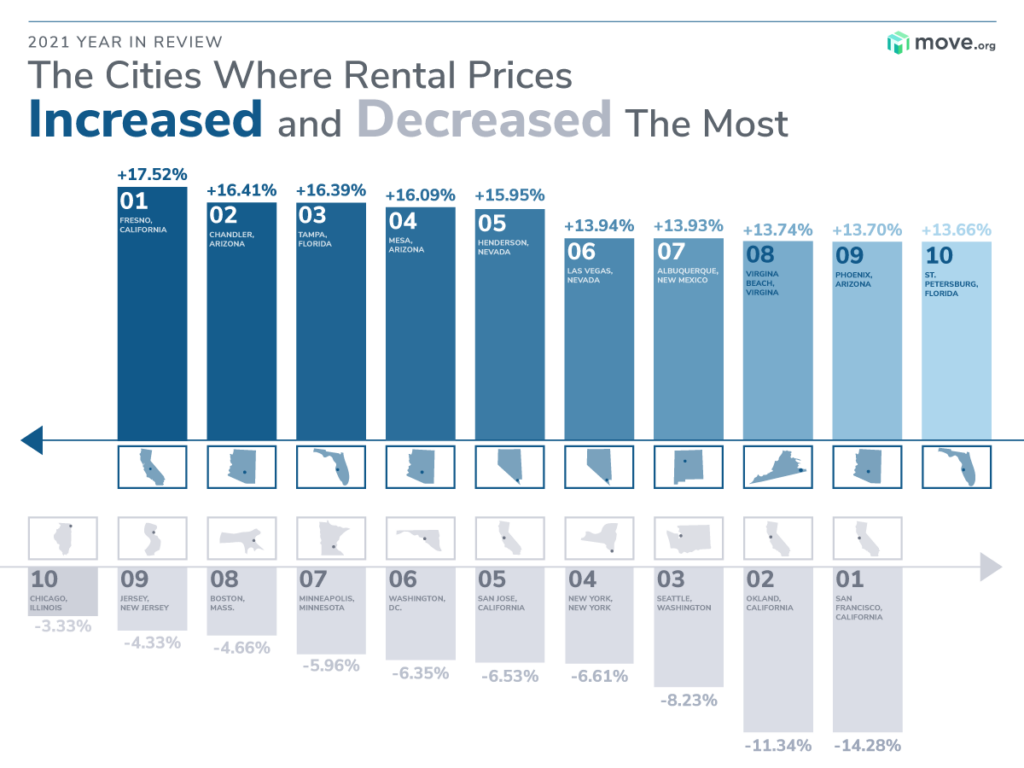
The most expensive change in average rental prices came from Fresno, California, increasing by a staggering 17.52%. A total of 19 cities, mainly in the West, saw average rent price increases over 10%, and 45 major US cities saw an average rent increase of 5% or more.

Top 10 cities where 1-bedroom apartment rent increased

Rank
City
Average rental price 2020
Average rental price 2021
Year-over-year change
1Fresno, CA$904.11$1,062.56+17.52%
2Chandler, AZ$1,240.11$1,443.56+16.41%
3Tampa, FL$1,062.78$1,237.00+16.39%
4Mesa, AZ$1,028.11$1,193.56+16.09%
5Henderson, NV$1,065.00$1,234.89+15.95%
6Las Vegas, NV$886.56$1,010.11+13.94%
7Albuquerque, NM$779.11$887.67+13.93%
8Virginia Beach, VA$1,169.22$1,329.89+13.74%
9Phoenix, AZ$924.89$1,051.56+13.70%
10St. Petersburg, FL$1,007.44$1,145.11+13.66%

Western states like California, Arizona, Nevada, and New Mexico faced some of the highest increases. Nevada and Arizona appeared in the top 10 highest rental increases list twice, and four California cities have rent growth of 10% or more.

On the eastern side of the US, two Florida cities, Tampa and St. Petersburg, and Virginia Beach, Virginia, faced rental increases of 13% or more.

But just because one city faced price increases in a state, other cities in the state had cheaper rent through 2021.


Where did rental prices decrease the most in the US?

San Francisco, California, had the most drastic rental price decrease of -14.28%. California had three cities in the top 10 rental price decreases, including Oakland and San Jose.

Aside from California, big city rent decreased the most in eastern states: Illinois, New Jersey, Massachusetts, Minnesota, New York.

Only seven big cities saw rent decrease by 5% or more from 2020 to 2021.

Top 10 cities where 1-bedroom apartment rent decreased

Rank
City
Average rental price 2020
Average rental price 2021
Year-over-year change
1San Francisco, CA$2,581.67$2,212.89-14.28%
2Oakland, CA$1,875.67$1,662.89-11.34%
3Seattle, WA$1,658.44$1,522.00-8.23%
4New York, NY$1,836.22$1,714.89-6.61%
5San Jose, CA$1,948.00$1,820.78-6.53%
6Washington, DC$1,787.89$1,674.33-6.35%
7Minneapolis, MN$1,164.78$1,095.33-5.96%
8Boston, MA$1,926.44$1,836.67-4.66%
9Jersey City, NJ$1,736.33$1,661.22-4.33%
10Chicago, IL$1,249.44$1,207.89-3.33%

After the pandemic caused several shifts, some of the biggest (or most historical) cities have become at least a little bit cheaper. For those moving to the East, you may be able to land a much better price than you could have a year ago.

However, for folks settling out west, most big cities aren’t exactly getting cheaper, so you’d be taking a gamble if you wait. We’ll have to see how 2022 shakes out for the renters in the US, but for the most part, rent’s on the rise.

Ready to move?

Company
Least expensive quote
Packing & loading services
Move.org rating
Discounts
Learn more
$9,000*
Icon Yes  LightYes
4.8 out of 5 stars
4.8
Icon Yes  LightMove.org discount, Military, Seniors
$6,214*
Icon Yes  LightYes
4.5 out of 5 stars
4.5
Icon No  LightNone
$4,500*
Icon Yes  LightYes
4.8 out of 5 stars
4.8
Icon Yes  LightSeniors
$848
Icon No  LightNo
4.6 out of 5 stars
4.6
Icon Yes  LightMove.org discount, Military
$1,170
Icon No  LightNo
4.5 out of 5 stars
4.5
Icon Yes  LightMove.org discount, Military

Data as of post date. Offers and availability may vary by location and are subject to change. Pricing data collected by requesting estimates from top moving container companies for four home sizes across six distances.

*Based on a 3-bedroom across-country move.


Methodology

We used Census data to develop our starting list of the 75 most populated cities in the United States.

We combined that data with apartment rental data from Apartment List and calculated the percent change in apartment prices from 2020 to 2021 using data from January to September of each year. Any city without apartment rental data was removed from the list and replaced with the next most populous city.

Then, we used monthly apartment rental prices from January to September 2020 and January to September 2021 to calculate the average cost of a one-bedroom apartment for each year. Using those averages, we calculated the percent change in apartment prices from 2020 to 2021.

Sources

  1. Census, “City and Town Population Totals: 20102019,” Accessed October 28, 2021.
  2. Apartment List, “Financial Conditions for Renters Before and During the COVID-19 Pandemic,”  Accessed October 28, 2021.
  3. Alexandra Dobre, Marie Rush, and Eric Wilson, Consumer Financial Protection Bureau, “Financial Conditions for Renters before and during the COVID-19 Pandemic,” September 2021.

2021 rent price changes in major US cities

Rank
City
Average one-bedroom rent price 2020
Average one-bedroom rent price 2021
Year-over-year change
1San Francisco, CA$2,581.67$2,212.89-14.28%
2Oakland, CA$1,875.67$1,662.89-11.34%
3Seattle, WA$1,658.44$1,522.00-8.23%
4New York, NY$1,836.22$1,714.89-6.61%
5San Jose, CA$1,948.00$1,820.78-6.53%
6Washington, DC$1,787.89$1,674.33-6.35%
7Minneapolis, MN$1,164.78$1,095.33-5.96%
8Boston, MA$1,926.44$1,836.67-4.66%
9Jersey City, NJ$1,736.33$1,661.22-4.33%
10Chicago, IL$1,249.44$1,207.89-3.33%
11Los Angeles, CA$1,607.89$1,574.67-2.07%
12St. Paul, MN$919.67$908.78-1.18%
13Portland, OR$1,184.33$1,171.00-1.13%
14Cleveland, OH$625.22$619.33-0.94%
15Philadelphia, PA$1,029.11$1,027.33-0.17%
16Honolulu, HI$1,527.33$1,526.67-0.04%
17New Orleans, LA$954.44$957.220.29%
18Pittsburgh, PA$902.44$913.671.24%
19Houston, TX$923.89$942.782.04%
20St. Louis, MO$824.67$844.782.44%
21Denver, CO$1,319.11$1,355.892.79%
22Milwaukee, WI$749.11$770.672.88%
23Kansas City, MO$917.56$949.003.43%
24Corpus Christi, TX$935.11$968.113.53%
25Long Beach, CA$1,400.33$1,452.673.74%
26Cincinnati, OH$684.22$710.333.82%
27Omaha, NE$811.11$843.003.93%
28Detroit, MI$657.33$687.224.55%
29Dallas, TX$997.67$1,045.564.80%
30Columbus, OH$833.56$873.784.83%
31Indianapolis, IN$815.44$859.115.35%
32Anchorage, AK$987.44$1,040.895.41%
33Lincoln, NE$750.78$791.675.45%
34Fort Worth, TX$947.44$999.565.50%
35Santa Ana, CA$1,443.11$1,523.115.54%
36Baltimore, MD$953.22$1,006.895.63%
37San Antonio, TX$896.22$947.115.68%
38Wichita, KS$612.33$652.676.59%
39Tulsa, OK$710.56$758.566.76%
40Norfolk, VA$890.00$952.226.99%
41Austin, TX$1,232.33$1,320.677.17%
42Atlanta, GA$1,182.67$1,269.227.32%
43Arlington, TX$977.44$1,050.787.50%
44Aurora, CO$1,174.44$1,262.677.51%
45Anaheim, CA$1,510.44$1,624.567.55%
46San Diego, CA$1,560.00$1,678.007.56%
47Charlotte, NC$1,074.11$1,156.227.64%
48Oklahoma City, OK$783.11$846.228.06%
49Orlando, FL$1,149.56$1,242.448.08%
50Miami, FL$1,258.67$1,365.008.45%
51Fort Wayne, IN$628.89$682.448.52%
52El Paso, TX$739.67$803.448.62%
53Raleigh, NC$1,085.56$1,180.338.73%
54Sacramento, CA$1,148.44$1,250.118.85%
55Plano, TX$1,191.89$1,300.009.07%
56Lexington, KY$788.33$866.339.89%
57Chula Vista, CA$1,318.56$1,456.6710.47%
58Toledo, OH$581.11$642.6710.59%
59Greensboro, NC$820.89$913.6711.30%
60Tucson, AZ$784.78$874.2211.40%
61Colorado Springs, CO$958.56$1,072.3311.87%
62Memphis, TN$791.33$890.5612.54%
63Jacksonville, FL$937.11$1,058.4412.95%
64Riverside, CA$1,306.67$1,476.5613.00%
65Bakersfield, CA$832.56$941.6713.11%
66St. Petersburg, FL$1,007.44$1,145.1113.66%
67Phoenix, AZ$924.89$1,051.5613.70%
68Virginia Beach, VA$1,169.22$1,329.8913.74%
69Albuquerque, NM$779.11$887.6713.93%
70Las Vegas, NV$886.56$1,010.1113.94%
71Henderson, NV$1,065.00$1,234.8915.95%
72Mesa, AZ$1,028.11$1,193.5616.09%
73Tampa, FL$1,062.78$1,237.0016.39%
74Chandler, AZ$1,240.11$1,443.5616.41%
75Fresno, CA$904.11$1,062.5617.52%
Trevor Wheelwright
Written by
Trevor’s written about home products and services for over six years across editorial publications and retail/eCommerce sites. His work's been featured on Forbes, RealSimple, USA Today, MSN, BusinessInsider, Entrepreneur, PCMag, and CNN. When he’s not researching and writing, you can find him around Salt Lake City, Utah, snapping photos of mountains and architecture or seeking out some good tunes and friendly faces.